 USA
USA UK
UK Australia
 UAE
UAE Canada
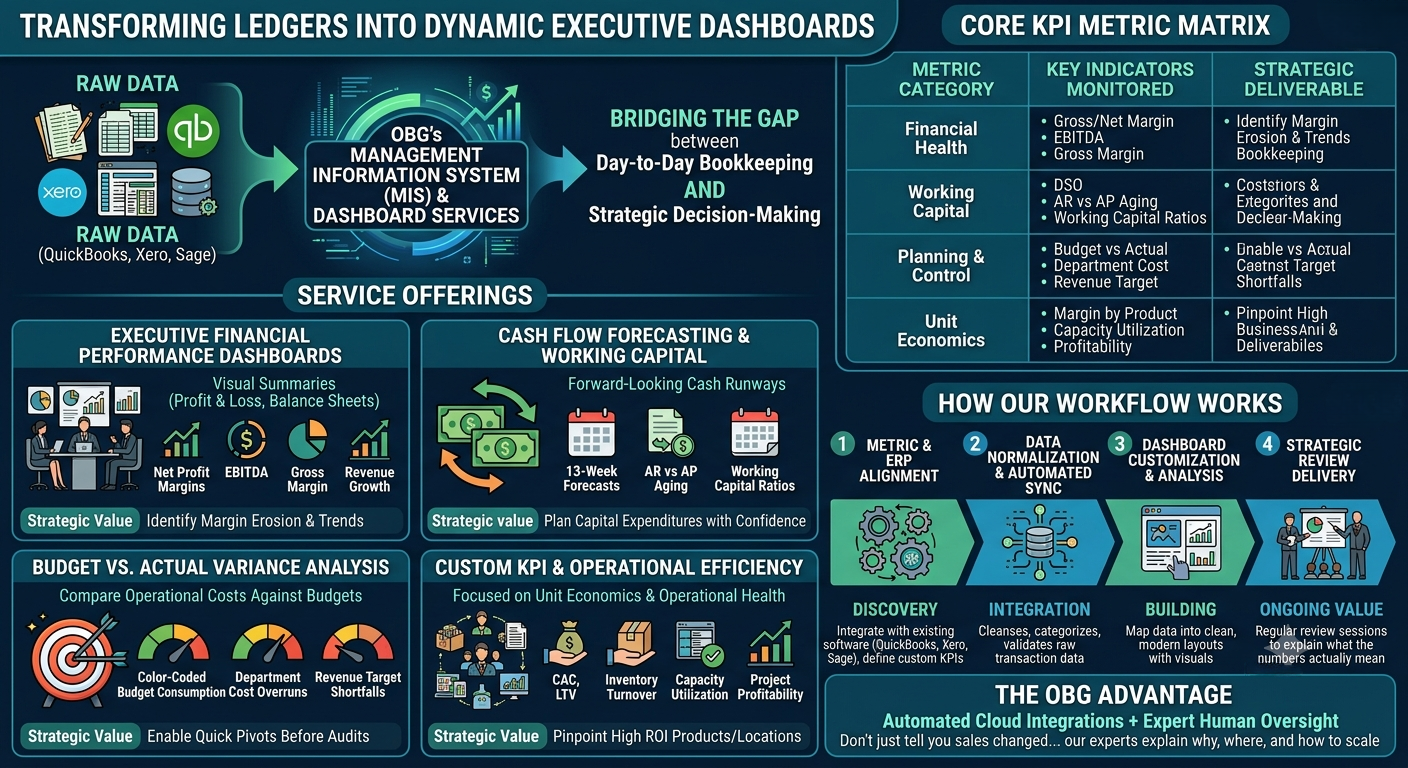
At OBG Outsourcing Private Limited, we translate dense transactional ledgers into dynamic, executive-ready management dashboards. Running a business through static spreadsheets or rear-view historical statements leaves leadership blind to operational leaks and real-time cash flow risks.
Our Management Information System (MIS) and Dashboard services bridge the gap between day-to-day bookkeeping (QuickBooks, Xero, Sage) and strategic decision-making.
Service Offerings
1. Executive Financial Performance Dashboards
Transform monthly Profit & Loss and Balance Sheets into scannable, visual summaries for C-suite leaders, board members, and investors.
Key Visuals: Real-time net profit margins, EBITDA tracking, gross margin breakdown, and revenue growth trajectory.
Strategic Value: Quickly identify margin erosion and revenue trends without digging through thousands of line items.
2. Cash Flow Forecasting & Working Capital Tracking
Never face a liquidity crunch. We build forward-looking cash runways that track inflows, outflows, and short-term capital requirements.
Key Visuals: Rolling 13-week cash flow forecasts, Accounts Receivable (AR) vs. Accounts Payable (AP) aging buckets, and Working Capital ratios.
Strategic Value: Plan capital expenditures, debt repayments, and dividend distributions with total confidence.
3. Budget vs. Actual Variance Analysis
Pinpoint exact performance gaps by comparing real-time operational costs against annual budgets or rolling forecasts.
Key Visuals: Color-coded budget consumption charts, department-wise cost overruns, and revenue target shortfall alerts.
Strategic Value: Enable quick pivots before end-of-quarter financial audits.
4. Custom KPI & Operational Efficiency Analytics
Tailored visual reporting focused on unit economics and operational health across different business segments.
Key Visuals: Customer Acquisition Cost (CAC), Lifetime Value (LTV), inventory turnover ratios, billable capacity utilization, and project-based profitability.
Strategic Value: Pinpoint which products, services, or locations are driving the highest ROI.
Core KPI Metric Matrix
| Metric Category | Key Indicators Monitored | Strategic Deliverable |
|---|---|---|
| Financial Health | Gross & Net Profit Margin, OpEx Ratios, Cash Runway | Executive Summary & Board-Ready Decks |
| Working Capital | Days Sales Outstanding (DSO), Days Payable Outstanding (DPO) | AR/AP Cash Flow Acceleration Dashboard |
| Planning & Control | Budget vs. Actual Variance, Revenue Run Rate, EBITDA | Monthly Variance & Trend Analysis Reports |
| Unit Economics | Margin by Product/Service Line, Project Costing | Granular Profitability Matrices |
How Our Workflow Works
1.Metric & ERP Alignment:Phase 1: Discovery.
We integrate with your existing software ecosystem (QuickBooks, Xero, Sage, or custom ERPs) and define custom KPIs aligned directly with your business goals.
2.Data Normalization & Automated Sync:Phase 2: Integration.
Our accounting team cleanses, categorizes, and validates your raw transaction data to ensure complete accuracy across all ledgers.
3.Dashboard Customization & Analysis:Phase 3: Building.
We map data into clean, modern visual layouts complete with variance indicators, trend graphs, and performance benchmarks.
4.Strategic Review Delivery:Phase 4: Ongoing Value.
We don't just deliver a static report. OBG's financial analysts conduct regular review sessions with your leadership team to walk you through what the numbers actually mean for your next big move.
The OBG Advantage: We combine automated cloud integrations with expert human oversight. Instead of merely telling you sales changed by 15%, our financial experts explain why it changed, where costs went, and how to scale that outcome next quarter.
Software We Use


